by Luke Simandle
In 1935, Emma Lee Aderholt would create a campus map with the help of assistants [fig 1]. This map, when analyzed and contextualized, can illuminate a broader picture of women participating not only in map-making but in the making of Pictorial maps. In order to accomplish this, it is necessary to determine how her map fits into trends during this time. She employs a combination of trends such as; creative and stylish borders, the use of characters or doodles, all of which enhance the reader’s connection with the work. It is also necessary to mention possible ways that Aderholt would have been made aware of trends. This can be accomplished by examining: the pervasiveness of mapmaking in early schooling during this time, how intertwined artists were with cartography, a class that focused on using maps for education while Aderholt was a student, and the publication of a book that makes use of maps to instruct by a professor of History at Aderholt’s school in the same year she would create the map. With the help of these details we can establish that Aderholt most likely was aware of these trends, it establishes her map as a piece of women’s history, and helps determine what role womanhood would play in cartography.
Before looking at the map itself, it is important to understand Aderholt herself and why she was chosen to create the campus map. She was a notable artist before she drew the map. Only one year prior, she had won 3rd place in a Textile Exposition and Style Show.[1] A year later, she would become both a Home Economics and art teacher in the Greensboro school system.[2] Aderholt would also have her art featured in the National Gallery of Art, albeit after 1935.[3] Her artistic abilities are evident in almost every aspect of the map she would create; it features doodles that encapsulate the feeling of campus, it features a border that demonstrates the evolution of the college and the women who are enrolled, and the map is high quality, especially compared to previous campus maps[1] [fig 1].
While it is apparent that Aderholt used her knowledge of cartography and art when creating this map, these features have an additional reason for their inclusion. The map was designed as an attempt to fundraise for a scholarship for home economics majors. Since they were relying on student purchases, they made use of these nostalgic doodles and borders to persuade students to buy the map. The map was also used in other contexts; most notably, it appeared as a simplified version in the 1934 yearbook as a decorative frontispiece[fig. 2]. This inclusion of a simplified map helps highlight the more professional nature of the work compared to the original map by removing the more imaginative drawings. These factors, when combined, demonstrate a level of artisanry that displays the level of detail Aderholt was making use of.
While these features display great detail and can be found on popular maps during the time, it is hard to pin down a specific genre in which they appear. Pictorial maps feature illustrations, but may not be drawn entirely to scale, and as Judith Tyner, a professor in geography, would write, “they are designed to be eye-catching and usually amusing.”[4] Alternatively, bird’s-eye view maps often feature borders, and she describes them as “maps that show the land as an oblique view.” These map types may seem somewhat unrelated at first glance; however, these genres were actually very similar. One map created in circa 1920, while it was a birdseye view, was called a Pictorial map, Stephen J. Hornsby wrote in his book on the history of pictorial maps that this was “an explicit recognition of the close affinity between the two forms.”[5] Because these two forms of mapmaking are so intertwined, it makes sense that Aderholt would include aspects like the border and doodles when creating her bird’s-eye map.
One of the most eye-catching aspects of Aderholt’s work is the aforementioned use of doodles on her map, whether it be the graduating students or the students participating in Mayday. These doodles are an important feature of pictorial maps and are used to help emphasize or encapsulate what a particular area or environment was like or perceived to be like. This causes different events to appear on the map that would’ve occurred in distinct times, like hazing at the beginning of the year, and graduation towards the end. Similar doodles can be seen in the maps drawn by a woman named Ruth Taylor White in the 1930s. Similar to Aderholt, White would also have an interest in art, and she would ultimately pursue a degree in it. Her art piece Island of Maui which can be seen in [Fig. 3] features
“boats under full sail and steam ships, and the land crisscrossed by railroads and automobiles on paved roads. Tourists arrive by the shipload to play golf, fish, hike, surf, swim, and motor around the islands, while the locals throw luaus and dance the hula.”[6]
These doodles share a very similar purpose to the ones featured on the Aderholt map. They were used to evoke a sense of nostalgia in those who were finishing their stay in Hawaii, just like how Aderholt’s map was used to evoke a sense of nostalgia in the students who were either finishing their stay at the women’s college or had already done so.
Despite the differences in the style of their illustrations, both White and Aderholt were able to convey the spirit of the places that they were depicting. Aderholt has a much simpler style in her map. Her characters on the map itself are all stick figures, and outside of trees and buildings, the map is extremely simplistic. Conversely, White’s map features characters with higher amounts of detail: having characters with different hair, skin colors, and complex outfits. Despite these differences in style, they accomplish the same goal of pictorial maps, the goal of using “map, image, and text, frequently for the purposes of telling a visual story or to capture a sense of place.”[7]
Returning to the use of borders, we can see clearly how the border was designed to be used in Aderholt’s map. This border doesn’t have an official reason for its inclusion, only a description in an issue of the 1935 Alumni News. However, because language like “modern girl” and “from the time it was founded to the present time” is used in their description, I believe it is there to add further context on how the university has changed over the years, paralleling the technology. One aspect of the border that furthers this interpretation is the text found on it. “It’s said tis so that years ago to college they did go very differently from the way that we go today.”[8] While other words describe the illustrations themselves, this sentence relays just how much has changed since its inception.
There are many examples of similar borders that add context to the map, through notable buildings, surrounding cultures, or even smaller maps. One of the more similar borders to Aderholt’s can be seen in [Fig 4] and was created in 1926 by two women, Alice York and Ilonka Karasz. Within this map’s borders, there is also a timeline, albeit one that focuses on notable people, gods, and myths. Figures range from humans discovering fire, to leaders such as Hammurabi or Justinian, or finally to religious figures like Jesus, Buddha, or the Roman/Greek Pantheon.[9] Another Map with borders that I think provides context for the map that Aderholt would later create is a map that was created in 1933 by August Kaiser, [Fig. 5]. The border of this map features a history of America that ranges all the way from Christopher Columbus’ arrival in the Americas, all the way to the United States being seen as a world power after theSecond World War.[10] This border does share a similarity outside of just providing further context with the Aderholt map, as its border also features text to describe the events that are occurring (albeit with much more text) This, in addition to the previous map by York, helped put into context some of the trends during Aderholts’s era and, as a result, some of the decisions that she would make regarding designing her border.
It is much easier to establish that there were trends in the mapmaking world during this time than it is to establish that Aderholt was aware of them; despite this, the latter is not a futile attempt. Firstly, there are records of mapmaking occurring in schools as an exercise primarily for women; “Maps commonly made by schoolgirls were world maps and maps of the United States.”[11] It is possible that Aderholt’s curriculum would’ve included a similar exercise before she entered college. Furthermore, the pictorial and illustrative genre was an important avenue for female artists. Tyner would say, “Pictorial and illustrative mapping is the mode that has had the greatest number of named women working and with a wide range of maps and map types.” [12] Because Aderholt chose to incorporate both pictorial and illustrative elements, it points to the fact that she would’ve been aware of these trends. In addition to this, there are records of college classes being offered during her enrollment at the Women’s College that included resources on mapmaking and how to include it as a teacher. Moreover, a professor at the women’s college would publish a book regarding the history of North Carolina in the same year as her map, which uses multiple maps to convey the history. While this book is not a smoking gun of map education, it does provide an example of how maps can be used in order to better teach history, especially for the women who would go on to become teachers. She also most likely would have heard about these trends as an artist, since most mapmakers during this period had a background in Art and often pursued other projects outside of mapmaking. Hornsby mentions in Picturing America the careers of five important artists outside of mapmaking.
“For all five artists, the creation of pictorial maps was but one part of their oeuvre. Owens churned out newspaper sketches, Mora painted and sculpted, Chase designed greeting cards, Annand illustrated book jackets, and Karasz crafted everything from magazine covers to textiles.”[13]
In combination with the inclusion of mapmaking in women’s curriculum and because of the history of these famous mapmakers being artists first, there is reason to believe that Aderholt also fits into the trend of artists who were capable of being great mapmakers.
Aderholt was not the only woman at the Women’s College who would create campus maps. While other maps before Aderholt’s made use of informative borders and/or doodles, it was unique for maps of the university during this time period to feature them. Both of the maps [Fig. 6-7], drawn by Lillian Gorham Crisp, feature similarities. These maps share the writing of the road names on the roads themselves, or the 1893 grounds map featuring linework that is rough around the edges and indicates a handmade or casual feel.[14] Despite these similarities, Crisp’s map would feature differences; her map would be missing both doodles, a border, and even the presence of buildings. This characteristic of these campus maps wasn’t limited to Crisp, however, as we can see the same theme in the map [Fig 8] created around twelve years later by an unknown author. This map shares other aspects with the Aderholt map, like having the names of the buildings on them or labeling the parks on the grass. Lastly, this map also has the name of the university in the same location.[15] While not a new map, a different version of Aderholt’s map can be seen in the 1935 issue of Pine Needles. The map is smaller, the buildings are in greater detail, and it features the school’s seal. Despite this professionalism, this map lacks several important features, such as the artistic borders, doodles, and names and quotes that express character. Because of this combination of precedents with lots of pictorial maps featuring doodles and borders, and the lack of these on the on-campus maps. The addition of Aderholt’s border and doodles, while not a wholly new idea, was a somewhat creative decision that greatly added to the story of the campus itself.
When I was first tasked with researching extra context for the map created by Aderholt, I was unsure what aspects of it were historically relevant, and simply saw it as a cute art project. However, upon closer inspection, something different is apparent. The creation of this map fits into a larger history of both women and cartography. As seen by Aderholt’s supposed knowledge of maps, and the education of women (especially those who were artistically inclined), who were taught how to create maps and were aware of trends that existed for maps during their time. Women during this time were also more commonly seen creating pictorial maps, which can also be exemplified by Aderholt choosing to create her map in the style that she did. Because of this, Emma Lee Aderholt’s map of the Women’s College is a historically significant example of how maps played a role in the education of women in the early to mid-20th century.
Annotated Bibliography
Primary Sources:
Arnett, Alex Mathews, and Walter Clinton Jackson. 1933. The Story of North Carolina. Chapel Hill: University of North Carolina Press.
This book is written by a former professor of geography at the Women’s College of
The University of North Carolina, two years before Aderholt would construct her map. This book features several maps that display the industry, early settlement in the state, and an early birds-eye view of early colonization of North Carolina. These maps help display a history of North Carolina maps, but also maps that a professor at the college aderholt attended thought were important to the state’s history.
Byrd, Clara Booth. February 1935. Alumnae news [February 1935]. Greensboro, N.C.: Woman’s College of the University of North Carolina. Martha Blakeney Hodges Special Collections and University Archives, UNCG University Libraries; Alumnae News / Alumni News / UNCG Magazine
This source includes an excerpt on the map on page 13. This excerpt assists in defining the purpose of the border.
Harrington, Mildred. 1913. The Carolinian [1913 Yearbook]. Greensboro, N.C.: State Normal and Industrial College. https://gateway.uncg.edu/islandora/object/ua%3A283619.
The maps found in this yearbook were created by Lillian Crisp in 1913 provides an interesting look at maps created by students twenty years prior to the creation of Aderholt’s map. This map looks very similar to the map created by Emma Lee Aderholt in the 1930s, and both feature items like McIver’s house and the main building. In addition to that, they also have a similar method for labeling the buildings present on campus with a floating caption above the buildings or written on the pavement. There are also some important things to learn by contrasting these maps. The Aderholt map is much more in-depth, both in the building detail and the difference in scale.
Frances Kernodle, The Carolinian [May 4, 1934]. Martha Blakeney Hodges Special Collections and University Archives, UNCG University Libraries; The Carolinian
This source features the results of a textile exposition in which Aderholt won first place, this demonstrates her artistic abilities.
Map of College Campus. 1925/6. Map. Martha Blakeney Hodges Special Collections and University Archives, The University of North Carolina at Greensboro.
This map of the college campus was created 10 years prior to the creation of Aderholt’s map. This map is drawn much more professionally compared to the Aderholt map, as they make use of very sharp/straight linework. In addition to the sharp linework, the map also features handwriting that is much more formal and similar to typed text. While I was unable to find a creator for this map, I think this map gives context to my research focus by adding to the number of campus maps that would come before the 1935 map and possibly influence its creation.
The Woman’s College of the University of North Carolina: The forty-third session [The catalogue 1934-1935]. 1935.Greensboro, North Carolina College for Women. Martha Blakeney Hodges Special Collections and University Archives, The University of North Carolina at Greensboro; Bulletins and Course Catalogs (Undergraduate)
This primary source is a course catalog record for the year that Aderholt was creating the map. In this catalog, there is a course in the education department that is titled “Materials and methods in Geography, and history in the upper grades.” While there is no certainty that Aderholt or one of her assistants took this course, I think it helps demonstrate the presence of learning about maps on campus and how there were people knowledgeable about maps on campus.
Scholarly Secondary Sources:
Griffin, Dori. 2017. “Beautiful Geography : The Pictorial Maps of Ruth Taylor White.” Imago Mundi.
This article focuses on the maps of Ruth Taylor White, and while she was not from the American South, she did depict it in a featured map of the entire United States of America. In addition to these maps, she also created several other countries at the time, like Hawaii and the Philippines. While these maps may seem wholly unrelated, I think that they demonstrate several important aspects of maps that we see in the 1935 Aderholt map. These maps all feature a compass rose with a symbol, similar to the compass rose found in the Aderholt map, with the seal of the university. They also depict illustrations that help display either what it was like or what White perceived it to be like during this time. The best examples can be found on the Hawaii map as we see countless depictions of the tourism there, with hikers, swimmers, and fishermen having a good time. Another aspect that these maps share with the Aderholt map is the borders. The Philippine map is surrounded by artistic interpretations of the island’s neighbors and how far away they are from Manila. Both this border and the border on the 1935 map enhance the viewing experience by providing extra context to the map itself.
Hornsby, Stephen J., and Ralph E. Ehrenberg. 2017. Picturing America: The Golden Age of Pictorial Maps. Chicago: The University of Chicago Press in association with the Library of Congress.
This source, by Hornsby, Stephen J., and Ralph E. Ehrenberg, shows a large variety of maps throughout history that are organised into six main categories: Amusement, Instruction, Place and Religion, Industry, War, and Post War. Because of this wide variety of maps, this source allows me to look for certain commonalities between the maps and how these might have had an influence on Aderholt. One important avenue for this is the introduction, which describes how influential the genre of Pictorial maps was and how the genre was uniquely American. As to how this fits my research focus, I think that the section on how influential they were was due to its mention of constant scale, and how maps during this era were somewhat homogeneous. There are also examples of birds-eye-view maps in this book, which help contextualise the inclusion of things such as the aforementioned border, the seal of the university, and the large title of the map.
Tyner, Judith A. Women in American Cartography: An Invisible Social History. Lanham, Maryland: Lexington Books, 2020
This book by Judith Tyner explains the history of women in cartography over the course of six chapters. In particular, I think that chapters one, five, and three will be useful for understanding the history of women mapmakers, as chapter one deals with women students and their teachers, while chapter three deals with women who produced pictorial maps for illustration purposes in books, and chapter 5 deals with maps in college and an academic sense. This book helps support my research focus by giving me an understanding of women as mapmakers and how they have evolved and changed throughout history. It will also allow me to see examples of maps created by historic women, and how Aderholt fits into that narrative as a woman who created a map that was bought and sold.
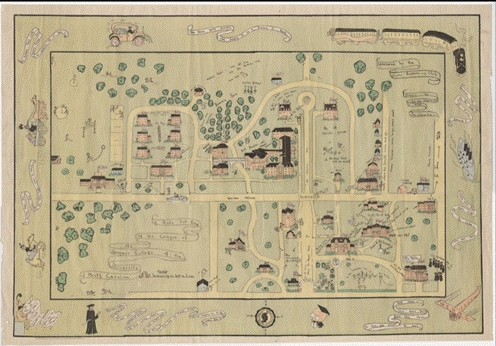
Figure 1. A bird’s eye view of the campus of the Women’s College of the University of North Carolina, 1935. Martha Blakeney Hodges Special Collections and University Archives, UNCG University Libraries; Blueprints, Drawings, and Maps
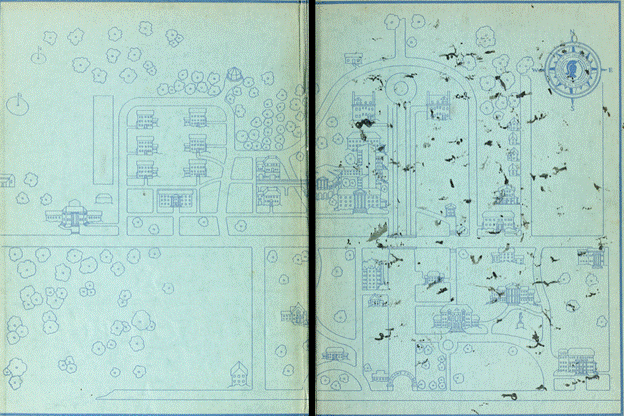
Figure 2. Woman’s College of the University of North Carolina. 1935. Pine Needles. [1935] Greensboro (N.C.) University of North Carolina at Greensboro, Digital Projects, UNCG University Libraries | PO Box 26170, Greensboro NC 27402-6170 | http://library.uncg.edu/dp | 336.256.2606
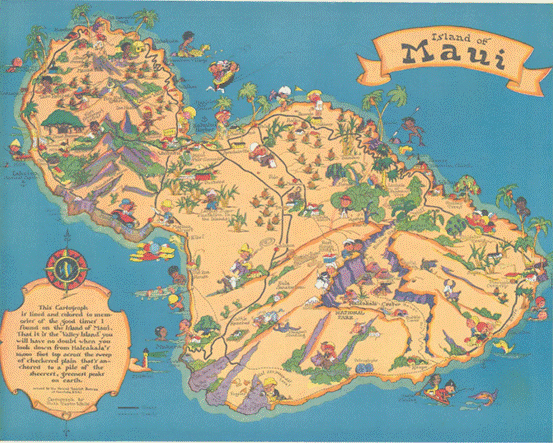
Figure 3. Island of Maui. 1930. Hornsby, Stephen J., and Ralph E. Ehrenberg. 2017. Picturing America: The Golden Age of Pictorial Maps. Chicago: The University of Chicago Press in association with the Library of Congress.
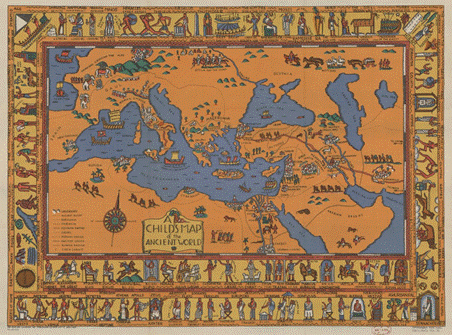
Figure 4. A child’s map of the ancient world : [Mediterranean Region and Near East], 1926. American Geographical Society Library – Maps, University of Wisconsin-Milwaukee Libraries
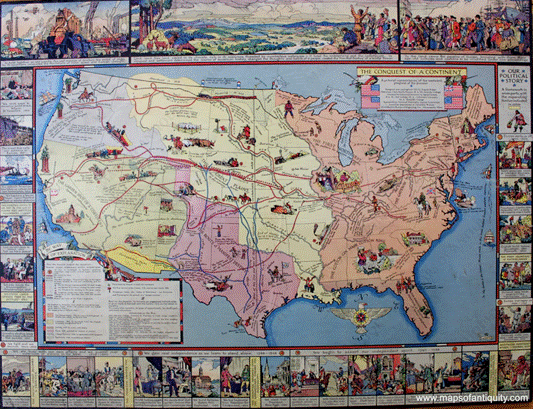
Figure 5. The Conquest of a Continent. A pictorial representation of the westward progress of the pioneer. 1933.
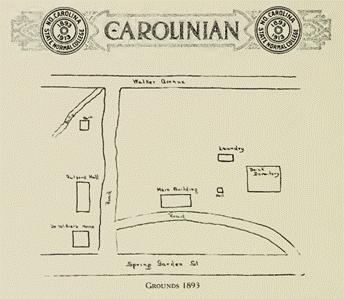
Figure 6. The Carolinan 1913, 1913. Martha Blakeney Hodges Special Collections and University Archives, UNCG University Libraries; University Yearbooks (UNCG University Archives)
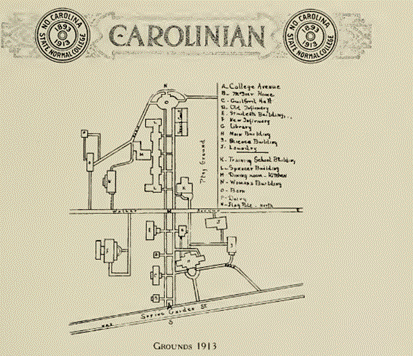
Figure 7. The Carolinan 1913, 1913. Martha Blakeney Hodges Special Collections and University Archives, UNCG University Libraries; University Yearbooks (UNCG University Archives)
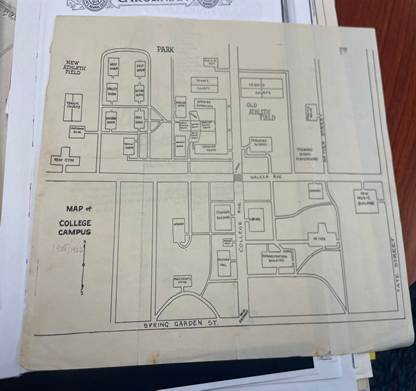
Figure 8. Map of College Campus. 1925/6. Map. Martha Blakeney Hodges Special Collections and University Archives, The University of North Carolina at Greensboro.
[1]Frances Kernodle, The Carolinian [May 4, 1934]. Martha Blakeney Hodges Special Collections and University Archives, UNCG University Libraries; The Carolinian
[2]Martie Groome-McGirt, Emma Lee Aderholdt Groome 4/27/2026, https://www.findagrave.com/memorial/42149141/emma_lee-groome
[3] Martie Groome-McGirt, Emma Lee Aderholdt Groome https://www.findagrave.com/memorial/42149141/emma_lee-groome
[4] Tyner, Judith A. Women in American Cartography : An Invisible Social History. Lanham, Maryland: Lexington Books, 2020 p37
[5] Hornsby, Stephen J., and Ralph E. Ehrenberg. 2017. Picturing America : The Golden Age of Pictorial Maps. Chicago: The University of Chicago Press in as;sociation with the Library of Congress. p9
[6] GRIFFIN, DORI. “Beautiful Geography: The Pictorial Maps of Ruth Taylor White.” Imago Mundi 69, no. 2 (2017): 233–47. https://www-jstor-org.proxy180.nclive.org/stable/48547833. p.5
[7]Dori Griffin Beautiful Geography p.5
[8]Clara Booth Byrd Alumnae news [February 1935]. Martha Blakeney Hodges Special Collections and University Archives, UNCG University Libraries; Alumnae News / Alumni News / UNCG Magazine.
[9]Hornsby, and Ehrenberg. 2017. Picturing America p82
[10] Hornsby, and Ehrenberg. 2017. Picturing America p88
[11] Tyner, Women in American Cartography 19
[12] Tyner, Women in American Cartography 50
[13] Hornsby, and Ehrenberg. 2017. Picturing America p41
[14]Harrington, Mildred. 1913. The Carolinian [1913 Yearbook]. Greensboro, N.C. : State Normal and Industrial College. https://ia800808.us.archive.org/14/items/carolinian1913nort/carolinian1913nort.pdf p83
[15] Map of College Campus. 1925/6. Map. Martha Blakeney Hodges Special Collections and University Archives, The University of North Carolina at Greensbormid-20tho
One thought on “A Bird’s Eye View of the Campus of the Woman’s College of the University of North Carolina”